Painless Multithreading: Five Easy Tips to Get Out of Debugging Hell
December 06, 2021
Story
One of the more underappreciated aspects of a multithreaded RTOS application is that you cannot just look at the code to fully understand how the application works.
You need to know how the various parts of it communicate with each other, and you need a lot of other information: how long do tasks take to execute, are there any potential race conditions or deadlocks, do you meet your timing requirements et cetera.
What you intended the code to do and what it actually does may differ in many ways that are both difficult to see in the code and difficult to test for. This is a challenge for all developers working with multithreaded code, whether they use an RTOS or Linux, and it is best managed with visual trace diagnostics tools that give you insight into what I call the “dark side” of the code — you can literally see how it behaves when it is executing.
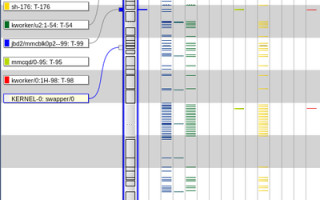
A visual timeline is a good starting point. Seeing software events, messages, and task executions spread out over time is important in many situations, such as when the precise location of a bug is not obvious from the symptoms—the computer may be phenomenal at number crunching and searching in text logs, but often you don’t know exactly what to search for. When it comes to visual pattern recognition the human brain excels.

A visual timeline showing software events gives you an overview of the inner workings of your embedded application and is a good starting point if you need to dig deeper to look for bugs.
Better insight while debugging means there will be less guesswork, and better odds to find the root cause(s). It is also a great help in those cases when a traditional method like halting the system on breakpoints cannot be used.
What about printf debugging, you say? Yes, printf is easy to deploy and sometimes it really is all you need, but it comes with a steep price. Placing debug printouts in time-sensitive application code is risky and does not scale well to more complex applications and faster processors. Also, printf is typically quite slow, on the order of several milliseconds per printout. In contrast, an optimized solution for software event tracing can be about 100x faster than that, allowing you to collect a lot more information over the same period.
Make sure that you measure timing and performance throughout the development project. Done right, this ensures that you can detect and address any issues during development rather than in a race against the clock right before the promised delivery date.
Meeting the timing specifications is crucial for real-time systems with hard requirements, but it is also important for the user experience of almost any embedded system. Nobody loves a sluggish touch screen or a slow wifi router that does not deliver the promised throughput. Again, the root cause may not be obvious from the source code, and simply switching to a faster processor might not do any good if the real problem is bad software design.
If you find yourself in “debugging hell” with a project, with massive amounts of debugging sucking up all energy in the room and preventing the project from moving forward, visual trace diagnostics can help you out. Failure to follow best practices in software design for RTOS-based applications is often a major contributing factor, and it can show up in the form of e.g., poor performance, high processor load or transient errors. A lot of dependencies between tasks is another common signal that the design could be improved.
Even badly architected systems may run today, but they’ll have complex and chaotic behavior combined with poor testability, which increases the risk for elusive bugs that leak out into production devices. And they will almost certainly be brittle, so that small changes in the code or the environment can cause them to fail.
Visual trace diagnostics helps the developer analyze and improve their software design and ensure stable and reliable system behavior. When you can find software design flaws earlier, fewer changes are required to fix them. Design improvements can also lead to better system performance and responsiveness, which in turn could allow you to select a more cost-effective processor to reduce BoM costs or use a lower clock frequency for longer battery life.
Use your tracing tool to continuously stream trace data to the host computer, where you can store very long recordings if necessary and even display the data live on the screen. Trace streaming enables you to e.g., monitor system tests or hunt down rare errors that are difficult to reproduce. Visual trace diagnostics allow for spotting anomalies in high-level visual overviews and drilling down to specific events to find out exactly what happened.
Finally, visual trace diagnostics can be realized as a pure software solution that requires no additional hardware, not even a debug probe. There is a cost in terms of memory and processor usage, but normally not more than that you can leave it on in your system throughout development, testing, and even in deployment if you like. Having this information available at all stages means that everybody benefits from it every day.
This approach allows for logging any relevant information from your application, including internal data and states that aren’t exposed during runtime. The data can be plotted in parallel with the visual execution timeline to provide deep insight into your application at runtime. This way, you can make a great product that beats the competition.
Follow these five best practices to gain the visibility you need into real-time behavior at the system level to improve product quality and speed up development to get to market faster.
Dr. Johan Kraft is CEO and founder of Percepio AB. Dr. Kraft is the original developer of Percepio Tracealyzer, a tool for visual trace diagnostics that provides insight into runtime systems to accelerate embedded software development. His applied academic research, in collaboration with industry, focused on embedded software timing analysis. Prior to founding Percepio in 2009, he worked in embedded software development at ABB Robotics. Dr. Kraft holds a PhD in computer science.