What Does 'Real-Time' Mean for Engineering Decisions?
December 21, 2021
Story
Real-time data is everywhere, generated by sensors that are embedded within a diverse range of technologies including automated vehicles, manufacturing equipment, and medical devices. But what does “real-time” really mean for engineering decisions, and more importantly, how is real-time data used?
Many engineers may assume the primary use of this data is predictive maintenance, monitoring the long-term viability of the equipment producing said data. While that’s certainly one potential use of this kind of data, it’s not the primary one. Real-time data is best processed by machine learning models capable of analyzing that data as quickly as it’s received. This data is then used to generate insights that are sent quickly, or in “’real-time,” to a database, dashboard, or device.
However, a common challenge for engineers is processing real-time data as the data in its raw form is too chaotic to be effectively analyzed. The use of machine learning models to process this data is helpful, but more importantly, engineers must effectively prepare the real-time data before it’s even put into these models.
Consider an automobile engine’s temperature gauge. In theory, the data collected from the gauge captures a single temperature per second. But the engine’s temperature is measured by multiple sensors, each featuring a slightly different measurement rate – known as a sampling rate, or time step – which must be synchronized into a single data set before it can be analyzed by a model. So, where should engineers get started with real-time data?
Try Synchronizing Data
On a macro level, the goal of synchronizing data is the same as synchronizing a watch – aligning one disparate time with another so that they flow together. On a micro level, the goal is to combine multiple disparate data points – essentially the seconds measured by several out-of-sync watches – into a single dataset, in real-time. Each data point is so infinitesimal, however, and the gaps between them so granular that synching them together requires careful preparation.
The first step in synchronizing real-time data is alignment. It can help engineers to start with a desired target – a specific time step or sample rate, such as every hour or every 10 seconds. However, real-time data models are often designed to only process 1 second of data at a time. Therefore, synchronizing raw equipment data requires creating a time vector that runs between 0 and 1 seconds, with a time step of 0.001 seconds, then “resampling” the data to match the new times.
With that in mind, the next step is where the art of data synchronization truly lies as engineers must decide how to fill in data points where times don’t match. This is usually done by resampling the original data. Several common resampling methods include nearest neighbor, aggregation, and interpolation, with the best choice depending on the initial time vector alignments and application requirements.
When engineers are unsure of the time alignment between datasets, a common solution is to fill the gaps with a constant value or missing data. This is helpful especially when many sensors are involved because exploring and visualizing the resulting data can help determine how to proceed with analyzing the rest of the data. If the times are closely aligned, any of the resampling methods noted can be used. If the times are not closely aligned, engineers should aggregate or interpolate the data.
Imagine converting hourly data into daily data. How can all data over 24 hours be represented in a single data point? One appropriate example in this scenario is data aggregation, say the daily mean. For non-numeric data, the mode, count, or nearest neighbor methods are more common.
When working with real-time sensor data, particularly where times are misaligned only slightly, many engineers use interpolation because it helps provide knowledge of trends in the data as there’s fewer time spaces to fill. If the points are farther away when working with real-time sensor data, a polynomial or spline interpolant is a more accurate method.
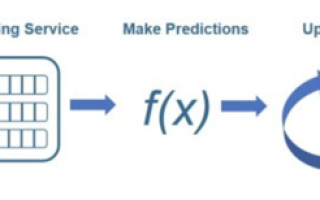
Below is an example of predicting equipment failure using sensors for temperature, pressure, and current.

Figure 1: Diagram of streaming workflow. © 1984–2020 The MathWorks, Inc.
In this example, a messaging service processes the raw sensor data, then applies it to a model, which is used to generate predictions in real-time. Once the predictions are generated, the model is updated and applied to the next set of real-time sensor data. These results are continuously and repeatedly sent to a dashboard in real-time.
The Difference Between Real-Time Data and Common Data
The process outlined to prepare real-time data might sound challenging. However, for engineers, it is common enough to be built into the APIs and modules of most data science platforms. Due to the common integration into data science platforms, there are often minimal additional data preparation considerations to be addressed before building models with real-time sensor data when following this process.
One such consideration should be planning a system, which means capturing all requirements and establishing parameters before building anything. Additionally, building a full streaming prototype early in the process can also be helpful as it allows engineers to return to tune algorithms while analyzing real-time data. Time windows can be another good parameter to consider as these often control how much data enters a system.
When building a model, it’s common for engineers to smooth and downsample datasets. With real-time data, frequency domain is added, creating a new parameter to consider before a model can analyze the data. Once the raw data has been organized into a single dataset with matching times, additional analysis is easier to perform.
Overall, as autonomous vehicles and medical devices alongside manufacturing equipment and other devices continue to be embedded with a diverse multitude of sensors, real-time data will become even more prevalent. As engineers look to continue providing valuable data-based insights on systems, navigating the “real-time” aspect of sensor data effectively will be important.
Heather Gorr holds a Ph.D. in Materials Science Engineering from the University of Pittsburgh and a Masters and Bachelors of Science in Physics from Penn State University. Since 2013, she has supported MATLAB users in the areas of mathematics, data science, deep learning, and application deployment. She currently acts a Senior Product Marketing Manager for MATLAB, leading technical marketing content in data science, AI, deployment, and advanced MATLAB and Python programming. Prior to joining MathWorks, she was a Research Fellow, focused on machine learning for prediction of fluid concentrations.

Heather Gorr holds a Ph.D. in Materials Science Engineering from the University of Pittsburgh and a Masters and Bachelors of Science in Physics from Penn State University. Since 2013, she has supported MATLAB users in the areas of mathematics, data science, deep learning, and application deployment. She currently acts a Senior Product Marketing Manager for MATLAB, leading technical marketing content in data science, AI, deployment, and advanced MATLAB and Python programming.