Beyond the Scope of Real-Time Embedded Debugging
August 12, 2019
Blog

In a real-time debugging context like an I2C environment, the oscilloscope can quickly become awkward because of the primary trigger that requires a repetitive signal.
The oscilloscope is the most popular and available MCU debug tool for the embedded developer. The oscilloscope faithfully captures repetitive analog signals as well as the repetitive MCU I/O digital signals, but the MCU’s capabilities of extended timing and irregular digital signals pose sophisticated timing challenges. Today’s MCU has a significant number of pins, busses, and I/O, that require a high-channel-count measurement system with sufficient memory for real-time debugging.
Embedded system testing includes the examination of baud rate, wait time, and output level status. In a real-world application, mid-range MCU devices have a Master Synchronous Serial Port (MSSP) modules to implement either the I2C communication protocols. Elongated I2C communication streams directly challenge oscilloscopes capability of measuring activities.
In an I2C protocol environment, there are master and slave devices. The important protocol communication requirements are the occurrence of the Start, Stop, ACK, and NACK signals in relation to the SDA and SCL levels (Figure 1).
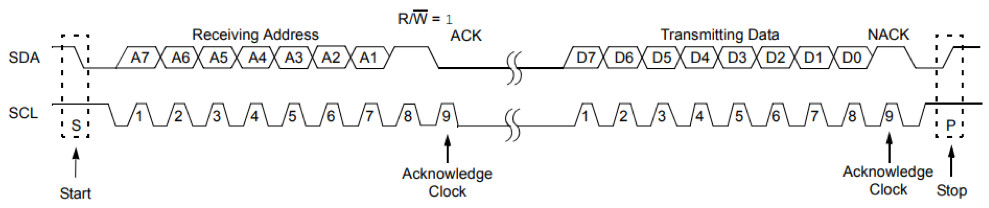
For a slave transmission, a masters wants to read data from the slave and sends a Start condition (S). The received address is loaded, and the slave sends an ACK pulse on the 9th bit. Following ACK, slave hardware lowers the SCL pin, starting the clock stretching period. With this stretched clock signal, the master is unable to assert another clock pulse until the slave prepares to transmit data. The transmit data is loaded into the slave register.
Then, the SCL pin is released, and the eight data bits are shifted out coincidental to the SCL input's falling edge, ensuring a valid SDA signal during the SCL high time. The NACK pulse from the master latches on the rising edge of the 9th SCL input pulse. If the NACK is high, the data transfer is complete. The slave idles and waits for the next Start bit occurrence. If the SDA line was low (NACK), the next transmit data must be loaded into the SSPBUF register.
A bus collision occurs any time the SDA line is sampled low, while it is outputting and expected high state. Once a bus collision is detected, the slave goes Idle and waits to be addressed again.
Today’s Embedded Test Tools
In a real-time debugging context like the I2C environment described above, the oscilloscope can quickly become awkward because of the primary trigger that requires a repetitive signal. On the other end of the debug tool spectrum, there is the full-blown Logic Analyzer.
Logic analyzers support greater channel counts and have come down in price thanks to PC technology. This also allows them to interface with larger screens that make it easier to visualize long sequences of digital events. However, they display signals in their digital form, and therefore provide only an indirect view of how firmware responds to different inputs. Thus, they are often more suitable for lower-resolution debugging tasks.
Software simulation is another inexpensive alternative, but it does not perform at the speed of modern MCUs. This problem is only compounded as the complexity of the system increases.
Hence the need for a debug solution that complements the oscilloscope, as well as a tool that has additional real-time MCU debugging capability.
Five-in-One Testing: The Five Wire Toolset
The Five Wire Toolset meets this embedded engineering challenge with high-speed logic sensing, analyzer, pattern generators, and an interface channel.
More succinctly, the Five Wire Tool has five main components (Figure 2):
- LiveLogic
- Logic Analyzer
- Logic Source Pattern Generator
- Waveform Generator
- Protocol Interactive Test Tool
These are paired with free PC software that provides a straightforward view of Five Wire output data.
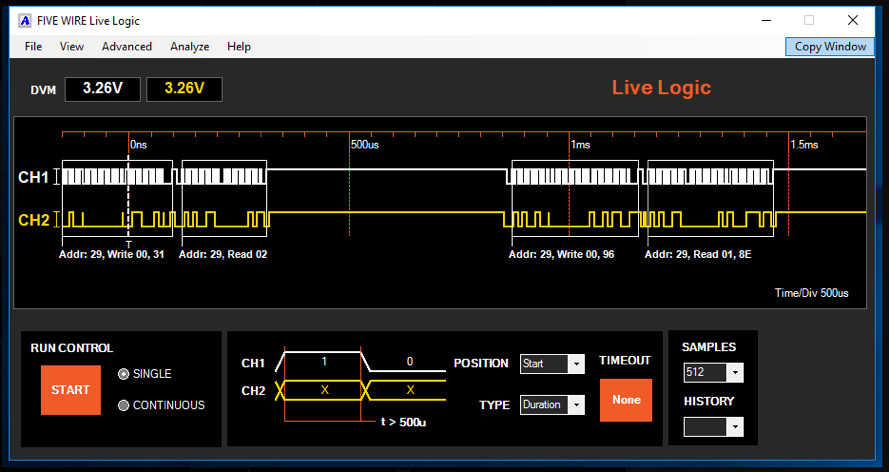
The LiveLogic tool operates like a digital oscilloscope. This user-friendly tool emulates an ultra-portable, lightweight oscilloscope. This tool has two digital channels (lower-left corner in Figure 2) that utilize scope probes, with a voltage input range of 0 to 16V using a 10X probe. These two channels can capture digital samples at rates of up to 400 Mega samples per second (Msps), rendering a time resolution of 2.5 nanoseconds (ns).
The LiveLogic tool conveniently captures signal transitions. The data for the wait time between transitions simply counts the idle time and the waveform’s digital level. This tool provides a live, scope-like digital display on an accompanying PC (Figure 3).
To contrast the LiveLogic tool, the Five Wire Logic Analyzer collects data through nine channels (lower right 20-pin socket, Figure 2). These channels integrate a 10 ns or 100 Msps logic analyzer that simultaneously supports multiple buses. The LiveLogic trigger has a three-level sequence with pattern match. With this channel width, the tool captures the entire MCU setting. Additionally, the Five Wire shipment includes a 10-wire logic analyzer probe.
The Logic Source Pattern Generator offers several output patterns. The generator has nine channels with a time resolution of 10 ns. The maximum number of vectors is 1,020 vectors, and the signal duration is 30 ns to 40 ms. Three numerous generation modes include single, on event, continuous, custom, and manual. The control commands include Goto, loop, wait for event, and stop.
Meanwhile, a Waveform Generator allows developers to set the amplitude (V) and waveform duration of an MCU’s integrated ADCs. The Protocol Interactive Test Tool facilitates communication between a PC and the Five Wire fixture, using a 20-pin bus emulation feature that supports both SPI and I2C.
Complementing & Contrasting the Oscilloscope Experience
The Five Wire Toolset is intended as a complement, rather than a replacement, to oscilloscopes in real-time debugging tasks. Portions of the Toolset are designed to enhance ‘scope outputs for embedded engineers. Conversely, the Toolset only captures and stores digital transaction data when a signal changes.
Timely Transactional Memory Usage
Because the test tool only stores signal transitions, the amount of time and transactional memory needed for signal analysis is reduced. This feature allows the Five Wire platform to display longer, more precise time periods, which alone takes users well beyond the capabilities of an oscilloscope. And since the Five Wire software suite runs on a PC, captured signals can be displayed across multiple, large screens for enhanced visualization during real-time analysis.
Returning to the I2C communications example mentioned previously, the LiveLogic tool captures I2C SDA and SCL lines for evaluation and can sense signals for an extended amount of time (Figure 4).
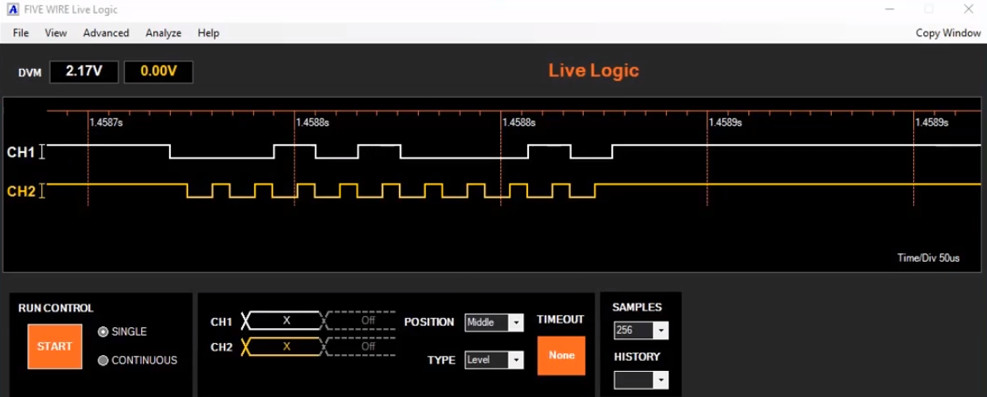
As shown in Figure 4, the LiveLogic CH1 is tracking the I2C SDA pin, and CH2 is tracking the SCL pin. Since the signals in Figure 4 are binary, the contents are difficult to decode visually.
Note that the signals occur at approximately the 1.4588 second time mark, which is well beyond an oscilloscope’s ability to track accurately. Compared to a traditional ‘scope, the Five Wire Toolset displays these signals longer and with a more granular level of temporal precision.
The LiveLogic PC software can decode SPI, I2C, RS232, or LIN signals. In the test represented in Figure 5, the Analyze Decoder is set to I2C.
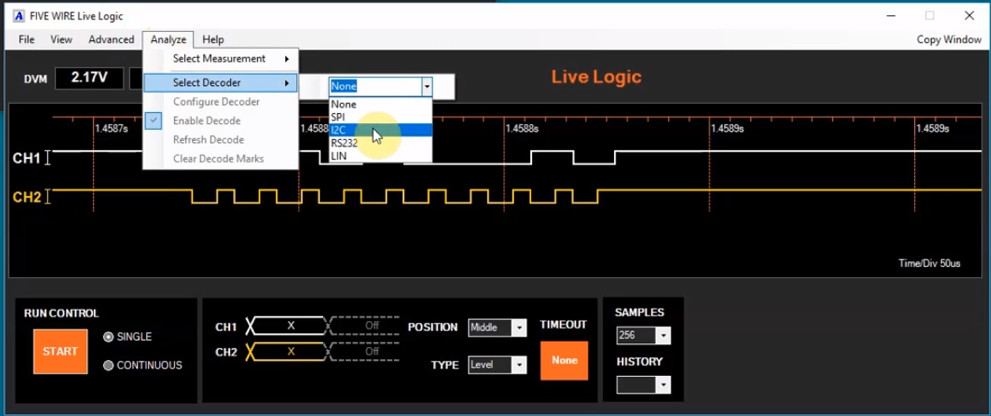
The LiveLogic I2C decode mode decodes the I2C signals as Addr:14, Write

The precision and performance are such that the Five Wire Toolset can even be used to debug RTOS-based designs.
Scripting Towards Test Automation
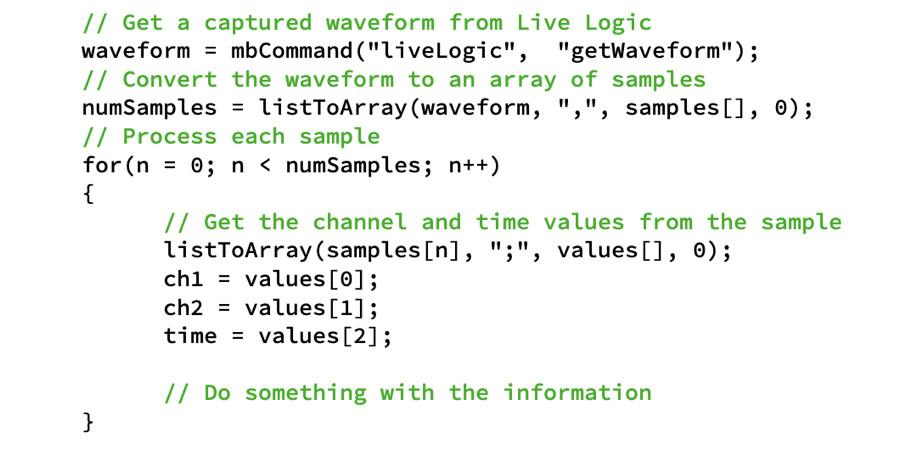
Another advantage of the Five Wire suite is the availability of a C-like scripting language that can be used to automate test setup. MBScript uses human-readable commands for each of the tools in the Five Wire Toolset to properly configure the tool for a given test, and also enables users to simulate circuits or generate complex, custom waveforms with conditional branches and loops.
Test data is likewise output in human-readable format that can be shared across development teams. Figure 7 shows MBScript commands that return a data array.
In theory, MBScript programming capability allows the Five Wire Toolset to double as a QA tool that simulates system operation under various conditions and loads. In fact, it is already being used in this capacity in real-world manufacturing facilities.
Clear Space on Your Workbench
The Five Wire tool brings added functionality to embedded system testing by augmenting performance without excessive costs. Indeed, the Five Wire Toolset is priced in the range of low-end oscilloscopes, while its capabilities far exceed those of many high-end solutions.
Because data is easily exported to a PC terminal in easy-to-consume, human-readable data formats that help engineers quickly capture waveforms and analyze a system’s digital operation. Reliable, accurate measurements from the test platform can be run through various test scripts, developed using the MBScript language or other popular coding paradigms like Python.
And, because the Five Wire software suite is free and can run independently of the hardware platform, entire engineering teams can analyze test data on their own Windows-based PCs. Rather than relying on multiple, single-purpose test systems, engineering and QA teams can share the multi-purpose functionality of a single Five Wire Toolset.
It’s time to make room for a new multi-purpose test tool on your workbench.
For more debugging tutorials with the Five Wire Toolset, visit www.fivewirelogic.com/debugging-tutorials.