Lauterbach Extends Its Android Debugging Support
September 05, 2017

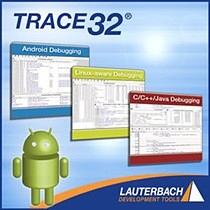
New TRACE32(r) Android support allows the debugging of ahead-of-time compiled Android framework and apps.
 |
| Android Debugging Tools |
 |
| Barry Lock, UK Manager, Lauterbach |
Lauterbach, the leading manufacturer of microprocessor development tools, has extended its Android debugging support for Android versions based on the Android RunTime (ART), and includes Android versions L, M and N.
Lauterbach’s TRACE32® debug tools have become a favourite with many hi-tech engineers, and the company is recognised for both engineering excellence and exceptional technical support. TRACE32® supports all the major families of microprocessor cores, covering products from 75 silicon companies. The quality and capability of Lauterbach tools enable engineering teams to develop robust code whilst minimising development time lost to debugging.
“The new Android support allows the debugging of the ahead-of-time compiled Android framework and apps,” said Barry Lock, UK Manager at Lauterbach. “Furthermore, TRACE32® automatically detects ahead-of-time compiled objects and loads the corresponding DWARF/ELF info. If the DWARF info is not available, the debugger can parse the OAT data to extract the debug information.”
TRACE32® supports the hybrid compilation introduced in Android N. For interpreted code, it is possible to display the stack frame with native to Java and Java to native transitions. A double click on a Java method displays the high level code together with the Dalvik disassembly. In case the code is just-in-time compiled, TRACE32® uses the symbols of the Android libart.so library to parse the JIT cache in order to get the names and ranges of the "hot" methods.
The TRACE32® Linux awareness also provides easy access to the kernel resources such as task lists, kernel logs and device tree. Debugging the Linux kernel, kernel modules as well as native processes and libraries over JTAG is possible by using dedicated menus and commands.
Thanks to its extended MMU support, TRACE32® allows access to the complete virtual address space. This gives the developer the ability to switch to the context of any process and inspect its status at any time.
Post-mortem debug is also supported. Raw memory images can be loaded into the TRACE32® instruction set simulator. By setting a few MMU configuration registers and loading the Linux awareness, you have easy access to your system state, at the moment where the memory dump was created.
About Lauterbach
Lauterbach is the world’s largest producer of hardware-assisted debug tools. Its engineering team has more than 30 years of experience in making world-class debuggers and emulators. The company attaches great importance to very high technical standards and only the latest development methods are used. This sound technical know-how has a high priority in the sales, support and training departments contributing to the technical expertise that is highly regarded by their customers across the world. www.lauterbach.com


