How Sensor Performance Enables Condition-Based Monitoring Solutions
August 13, 2019
Blog

Advancements in semiconductor technologies and capabilities are enabling new opportunities to sense, measure, interpret, and analyze data in industrial applications.
Advancements in semiconductor technologies and capabilities are enabling new opportunities to sense, measure, interpret, and analyze data in industrial applications and, in particular, condition-based monitoring solutions. Next-generation sensors based on MEMS technology, combined with advanced algorithms for diagnostic and prognostic applications, expand opportunities to measure a variety of machines and improve the ability to effectively monitor equipment, improve uptime, enhance process quality, and increase throughput.
To enable these new capabilities and capture the benefits of condition-based monitoring, new solutions must be accurate, reliable, and robust so that real-time monitoring can expand beyond basic detection of potential equipment faults to deliver insightful and actionable information. Performance of next-generation technologies combined with system-level insights enable a deeper understanding into the application and requirements necessary to solve these challenges.
Vibration, one of the key components of machine diagnostics, has been reliably used to monitor the most critical equipment across a wide range of industrial applications. A significant amount of literature exists to support the various diagnostic and predictive capabilities required to enable advanced vibration monitoring solutions. Less well covered is the relationship between vibration sensor performance parameters, such as bandwidth and noise density, and end application fault diagnostic capabilities. This article addresses the major machine fault types in industrial automation applications and identifies the key vibration sensor performance parameters that are relevant to the specific faults.
Several common fault types and their characteristics are highlighted below to provide insights into some of the key system requirements that must be considered when developing a condition-based monitoring solution. These include—but are not limited to—imbalance, misalignment, gear faults, and rolling bearing defects.
Imbalance
What is imbalance and what causes it?
Imbalance is an unequal distribution of mass that causes the load to shift the center of mass away from the center of rotation. System imbalances can be attributed to improper installations such as coupling eccentricity, system design errors, component faults, and even accumulation of debris or other contaminates. As an example, the cooling fans built into most induction motors can become unbalanced due to an uneven accumulation of dust and grease, or due to broken fan blades.
Why is an unbalanced system a concern?
Unbalanced systems create excess vibrations that mechanically couple to other components within the system such as bearings, couplings, and loads—potentially accelerating the deterioration of components that are in good operating condition.
How to detect and diagnose imbalance
Increases in overall system vibration can point to a potential fault created by an unbalanced system, but diagnosis of the root cause of the increased vibration is performed through analysis in the frequency domain. Unbalanced systems produce a signal at the rotational rate of the system—typically referred to as 1×—with a magnitude that is proportional to the square of the rotational rate, F = m × w2. The 1× component is typically always present in the frequency domain, so identification of an unbalanced system is done by measuring the magnitude of the 1× and the harmonics. If the magnitude of the 1× is higher than the baseline measurement and the harmonics are much less than the 1×, then an unbalanced system is likely. Both horizontally and vertically phase-shifted vibration components are also likely in an unbalanced system.1
What system specifications must be considered when diagnosing an unbalanced system?
Low noise is required to reduce the sensor influence and enable detection of small signals created by an unbalanced system. This is important for the sensor, signal conditioning, and acquisition platform.
Sufficient resolution of the acquisition system to extract the signal (especially the baseline signal) is required to detect these small imbalances.
Bandwidth is necessary to capture sufficient information beyond just the rotational rates to improve the accuracy and confidence of a diagnosis. The 1× harmonic can be influenced by other system faults, such as misalignment or mechanical looseness, so analysis of the harmonics of the rotation rate, or 1× frequency, can help differentiate from system noise and other potential faults.1 For slower rotating machines, fundamental rotation rates can be well below 10 rpm, meaning the low frequency response of the sensor is critical for capturing the fundamental rotation rates. Analog Devices’ MEMS sensor technology enables detection of signals down to dc and provides the ability to measure slower rotation equipment, while also enabling measurement of wide bandwidths for higher frequency content typically associated with bearing and gearbox defects.
Why is misalignment a concern?
Misalignment errors can impact the greater system by forcing components to operate under higher stresses, or loads, than what the components were originally designed to handle and can ultimately cause premature failures.
How to detect and diagnose misalignments
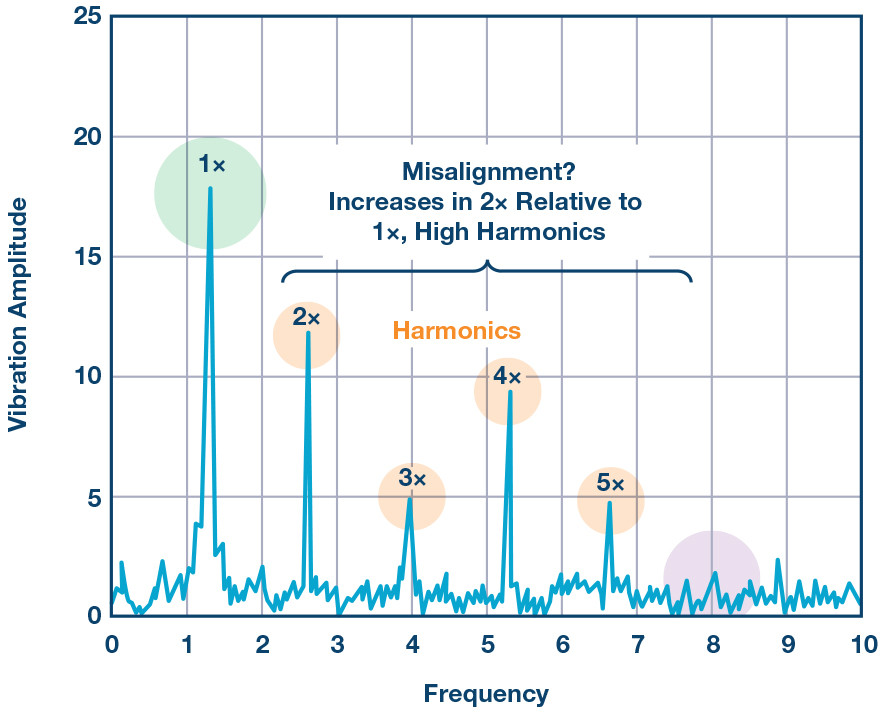
Misalignment errors typically show up as the second harmonic of the rotational rate of the system, referred to as 2×. The 2× component is not always present in the frequency response, but when it is, the relationship of the magnitude to the 1× can be used to determine whether a misalignment is present. Increased misalignments can excite harmonics out to 10× depending on the type of misalignment, the location at which it is measured, and the directional information.1 Figure 4 highlights the signatures associated with potential misalignment failures.

Misalignment
What is misalignment and what causes it?
System misalignments, as the name suggests, occur when two rotating shafts are not aligned. Figure 2 shows an ideal system where alignment is achieved starting with the motor, then the shaft, the coupling, and all the way to the load (which, in this case, is a pump).
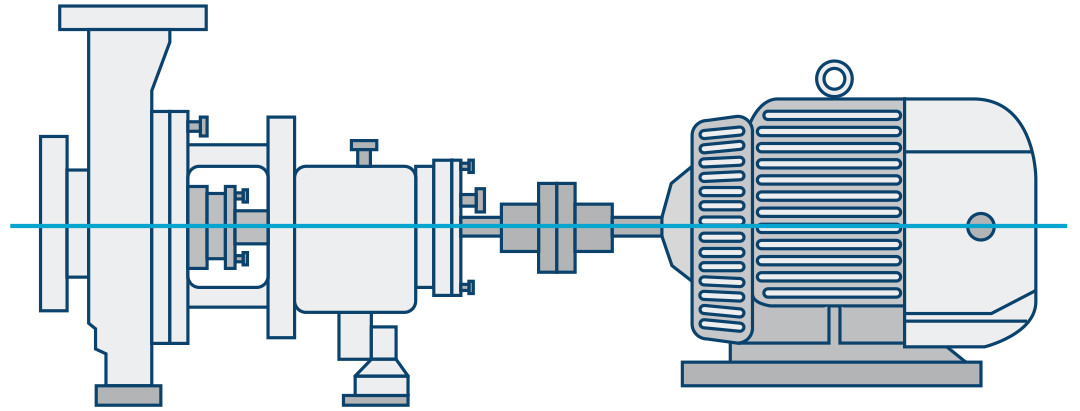
Misalignments can occur in the parallel direction as well as in the angular direction and can also be a combination of both (see Figure 3). Parallel misalignment occurs when the two shafts are displaced in the horizontal or vertical directions. Angular misalignment occurs when one of the shafts is at an angle relevant to the other.2

What system specifications must be considered when diagnosing a misaligned system?
Low noise and sufficient resolution are required to detect small misalignments. Machine types, system and process requirements, and rotational rates dictate the allowable misalignment tolerances.
Bandwidth is necessary to capture sufficient frequency range and improve the accuracy and confidence of a diagnosis. The 1× harmonic can be influenced by other system faults, such as misalignment, so analysis of the harmonics of the 1× frequency can help differentiate from other system faults. This is especially true for higher rotational speed machines. As an example, machines operating above 10,000 rpm, such as machine tools, will typically require quality information beyond 2 kHz in order to accurately detect imbalance with high confidence.
Multidirectional information also improves the accuracy of the diagnosis and provides insight into the type of misalignment error and the direction of the misalignment.
The phase of the system, combined with directional vibration information, further improves the diagnostics of a misalignment error. Measuring the vibration at different points on the machine and determining the difference in the phase measurements or across the system provides insights into whether the misalignment is either an angular, parallel, or combination of the two misalignment types.1
Rolling Element Bearing Defects
What are rolling element bearing defects and what causes them?
Rolling element bearing defects are typically artifacts of mechanically induced stresses or lubrication issues that create small cracks or defects within the mechanical components of the bearing, leading to increased vibration. Figure 5 provides some examples of rolling element bearings and depicts a couple of the defects that can occur.
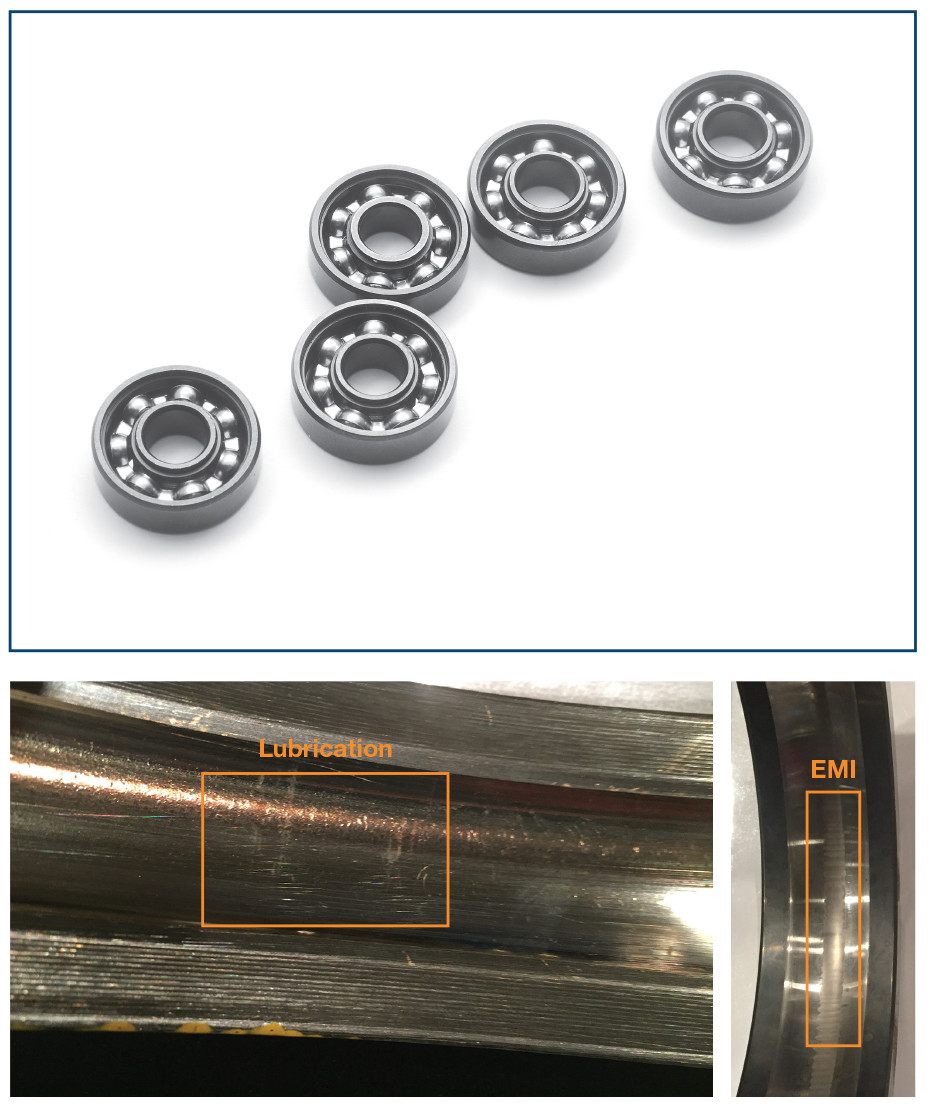
Why are rolling element bearing failures a concern? Rolling element bearings are found in almost all types of rotating machinery, ranging from large turbines to slower rotating motors all the way from relatively simple pumps and fans to high speed CNC spindles. Bearing defects can be a sign of contaminated lubrication (Figure 5), improper installations, high frequency discharge currents (Figure 5), or increased loading from the system. Failures can cause catastrophic system damage and have significant impacts on other system components.
How are rolling element bearing faults detected and diagnosed?
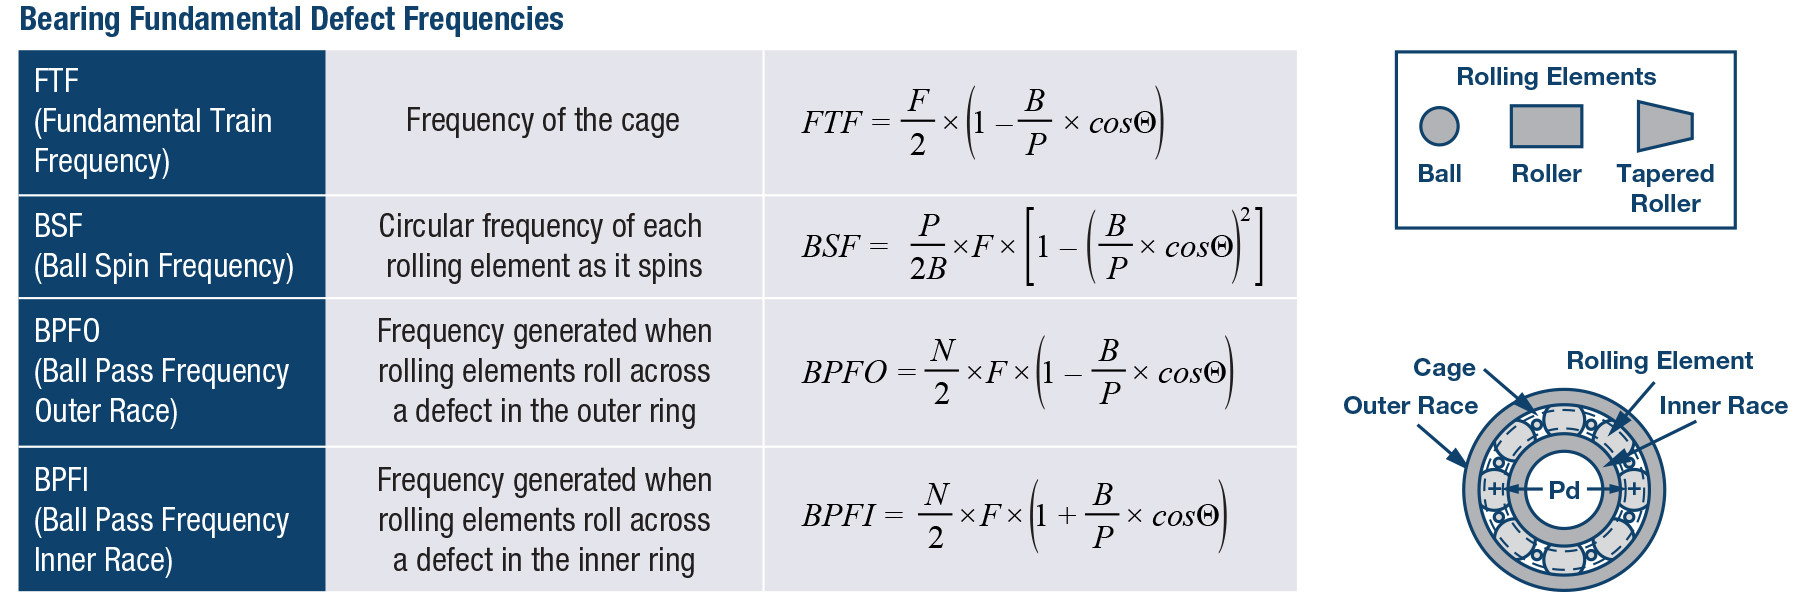
There are a number of techniques used to diagnose bearing faults and because of the physics behind bearing design, each bearing’s defect frequencies can be computed based on the bearing geometries, the speed of rotation, and the defect type, which aids in diagnosing faults. Bearing defect frequencies are listed in Figure 6.
Analysis of the vibration data from a particular machine or system often relies on a combination of both time and frequency domain analysis. Time domain analysis is useful for detecting trends in the overall increase of system vibration levels. However, very little diagnostic information is contained in this analysis. Frequency domain analysis improves diagnostic insights but identifying the fault frequencies can be complex due to influences from other system vibrations.
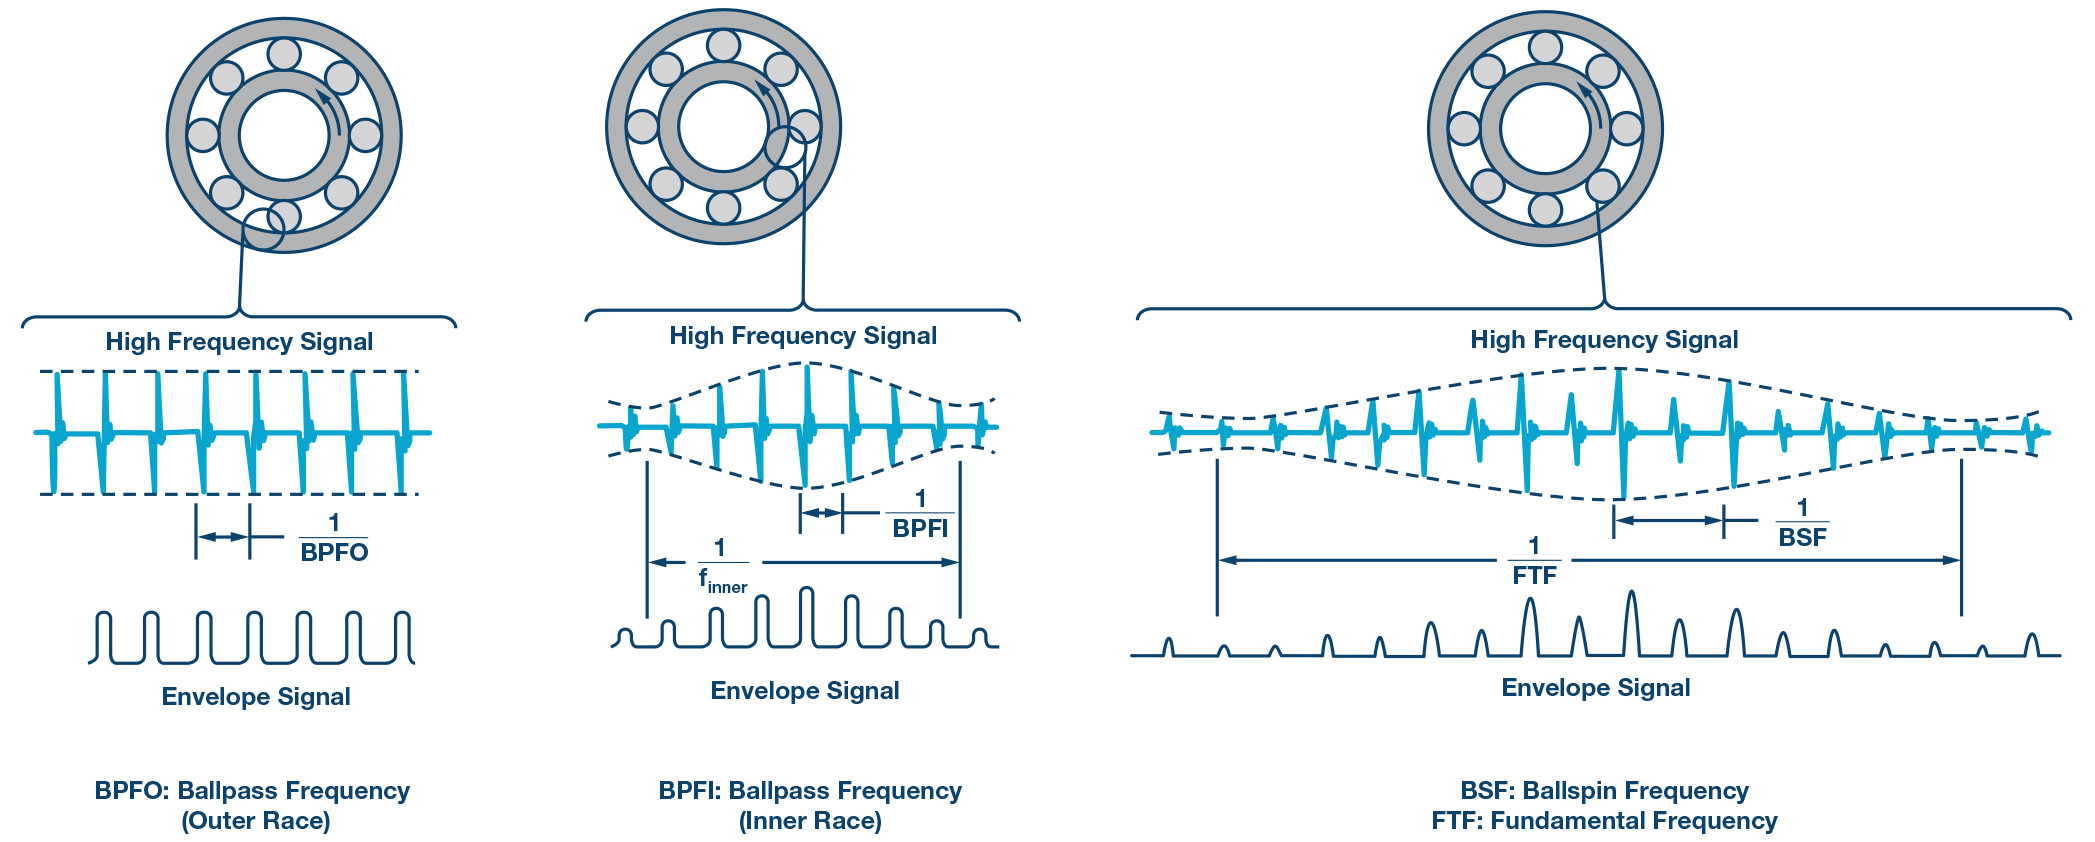
For early diagnosis of bearing defects, harmonics of the defect frequencies are used to identify the early stage, or incipient, faults so that they can be monitored and maintained before a catastrophic failure. In order to detect, diagnose, and understand the system implications of a bearing fault, techniques such as envelope detection, shown in Figure 7, combined with spectral analysis in the frequency domain typically provide more insightful information.
What system specifications must be considered when diagnosing a rolling element bearing fault?
Low noise and sufficient resolution are critical to the detection of early stage bearing defects. Typically, these defect signatures are low in amplitude during the onset of a defect. Mechanical slip, inherent to bearings due to design tolerances, further reduces the magnitude of the vibrations by spreading amplitude information across multiple bins in the frequency response of a bearing, thus requiring low noise to detect the signals earlier.2
Bandwidth is critical for early detection of bearing defects. An impulse containing high frequency content is created each time the defect is struck during a revolution (see Figure 7). Harmonics of the bearing defect frequencies, not the rotational rate, are monitored for these early stage faults. Because of the relationship of the bearing defect frequencies to rotation rates, these early signatures can occur in the several kilohertz range and extend well beyond the 10 kHz to 20 kHz range.2 Even for lower speed equipment, the inherent nature of bearing defects requires wider bandwidths for early detection to avoid influences from system resonances and system noise that influence the lower frequency bands.3
Dynamic range is also important for bearing defect monitoring as system loads and defects can impact the vibrations experienced by the system. Increased loads lead to increased forces acting on the bearing and the defect. Bearing defects also create impulses that excite structural resonances, amplifying the vibrations experienced by the system and the sensor.2 As machines ramp up and down in speeds during stop/start conditions or normal operation, the changing speeds create potential opportunities for system resonances to become excited, leading to higher amplitude vibrations.4 Saturation of the sensor can result in missing information, misdiagnosis, and—in the case of certain technologies—damage to the sensor elements.
Gear Defects
What are gear defects and what causes them?
Gear faults typically occur in the teeth of a gear mechanism due to fatigue, spalling, or pitting. These can be manifested as cracks in the gear root or removal of metal from the tooth surface. They can be caused by wear, excessive loads, poor lubrication, backlash, and occasionally improper installation or manufacturing defects.5
Why are gear faults a concern?
Gears are the main elements of power transmission in many industrial applications and are subjected to significant stresses and loading. Their health is critical to the proper operation of the entire mechanical system. A well-known example of this in the renewables field is the fact that the greatest contributor to wind turbine downtime (and consequent revenue erosion) is the failure of the multistage gearbox in the main powertrain.5 Similar considerations apply in industrial applications.
How are gear faults detected and diagnosed?
Gear faults are tricky to detect due to the difficulty in installation of vibration sensors close to the fault and the presence of significant background noise due to multiple mechanical excitations within the system. This is especially true in more complex gearbox systems, in which there can be multiple rotational frequencies, gear ratios, and meshing frequencies.6 Consequently, multiple and complementary approaches can be taken in the detection of gear faults, including acoustic emissions analysis, current signature analysis, and oil debris analysis.
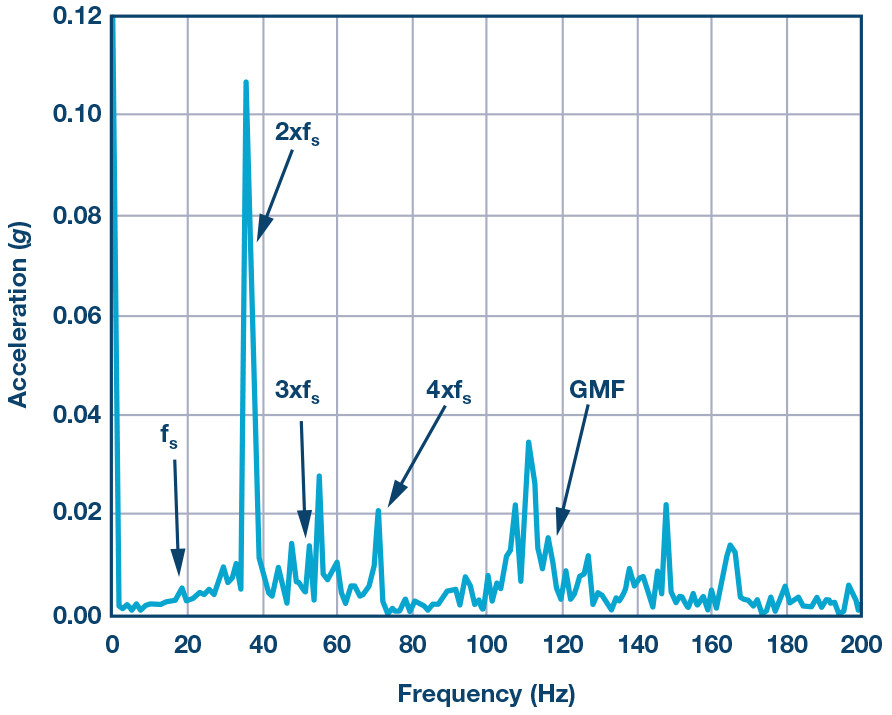
In terms of vibration analysis, the gearbox casing is the typical mounting location for an accelerometer, with the dominant vibration mode being in the axial direction.7 Healthy gears produce a vibration signature at a frequency known as the gear mesh frequency. This is equal to the product of the shaft frequency and the number of gear teeth. There typically also exist some modulation sidebands related to manufacturing and assembly tolerances. This is illustrated for a healthy gear in Figure 8. When a localized fault such as a tooth crack occurs, the vibration signal in each revolution will include the mechanical response of the system to a short duration impact at a relatively low energy level. This is typically a low amplitude, broadband signal that is generally considered to be non-periodic and non-stationary.7,8
As a result of these particular characteristics, standard frequency domain techniques on their own are not regarded as suitable for accurate identification of gear faults. Spectral analysis may be unable to detect early stage gear failures as the impact energy is contained in sideband modulation, which can also contain energy from other gear pairs and mechanical components. Time domain techniques such as time-synchronous averaging or mixed-domain approaches such as wavelet analysis and envelope demodulation are generally more appropriate.9
What system specifications must be considered when diagnosing a gear fault?
Wide bandwidth is generally very critical in gear fault detection, since the number of gear teeth acts as a multiplier in the frequency domain. Even for relatively low speed systems, the required detection frequency range is quickly pushed up in to the multiple kHz region. Moreover, localized faults further extend the bandwidth requirement.
Resolution and low noise are extremely critical for several reasons. The difficulty of mounting vibration sensors in close proximity to specific fault zones means that there is potentially higher attenuation of the vibration signal by the mechanical system, making it vital to be able to detect low energy signals. Furthermore, since the signals are not static periodic signals, standard FFT techniques to extract low amplitude signals from a high noise floor cannot be depended on—the noise floor of the sensor itself must be low. This is particularly true in a gearbox environment in which there is a mixing of multiple vibration signatures from different elements of the gearbox. Added to these considerations is the importance of early detection not just for asset protection reasons, but for signal conditioning reasons. It has been shown that vibration severity can be higher in the case of a one-tooth breakage fault, as opposed to a fault with two-or-more-tooth breakage, implying that detection may be relatively easier at the early stages.
Summary
While common, imbalance, misalignments, rolling element bearing defects, and gear tooth faults are just a few of the many fault types that can be detected and diagnosed with high performance vibration sensors. Higher sensor performance, combined with the appropriate system-level considerations, enable next-generation condition-based monitoring solutions that will deliver deeper levels of insight into the mechanical operation of a wide range of industrial equipment and applications. These solutions will transform how maintenance is performed and how machines operate, ultimately reducing downtimes, improving efficiencies, and delivering new capabilities to next-generation equipment.
Table 1. Requirements on Each Sensor Parameter
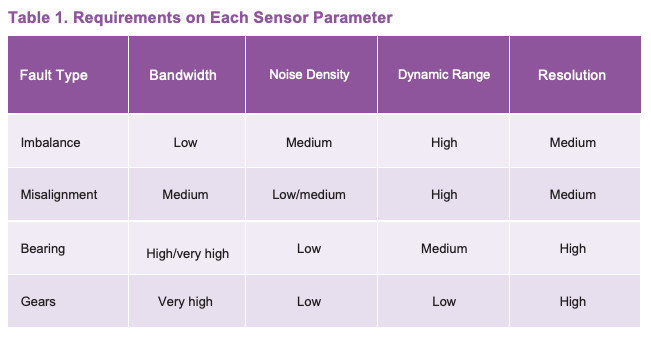
For Table 1, a low bandwidth is considered <1 kHz, a medium bandwidth is between 1 kHz to 5 kHz, and a high bandwidth is considered >5 kHz. A low noise density is considered >1 mg/√Hz, a medium noise density is between 100 μg/√Hz to 1 mg/√Hz, and a high noise density is considered <100 μg/√Hz. A low dynamic range is considered <5 g, a medium dynamic range is between 5 g to 20 g, and a high dynamic range is considered >20 g.
References
1 Jason Mais. “Spectrum Analysis: The Key Features of Analyzing Spectra.” SKF USA, Inc. 2002.
2 Robert Bond Randall. Vibration-based Condition Monitoring: Industrial, Aerospace, and Automotive Applications. John Wiley & Sons, Ltd., December 2010.
3 Scott Morris. “SKF Pulp and Paper Practices.” SKF Global Pulp & Paper Segment, No. 19, 2016.
4 Chris D. Powell, Erik Swanson, and Sorin Weissman. “A Practical Review of Rotating Machinery Critical Speeds and Modes.” Sound and Vibration, May 2005.
5 Shahin Hedayati Kia, Humberto Henao, and Gérard-André Capolino, “Trends in Gear Fault Detection Using Electrical Signature Analysis in Induction Machine-Based Systems,” 2015 IEEE Workshop on Electrical Machines Design, Control and Diagnosis (WEMDCD), Torino, pp. 297-303, 2015.
6 Alexander Bliznyuk, Ido Dadon, Renata Klein, and Jacob Bortman. “Gear Diagnostics—Fault Type Characteristics.” 2014.
7 Giorgio Dalpiaz, Alessandro Rivola, and Riccardo Rubini. “Effectiveness and Sensitivity of Vibration Processing Techniques for Local Fault Detection in Gears.” Mechanical Systems and Signal Processing, Volume 14, Issue 3, 2000.
8 Wenyi Wang. “Early Detection of Gear Tooth Cracking Using the Resonance Demodulation Technique.” Mechanical Systems and Signal Processing, Volume 15, Issue 5, 2001.
9 Kiran Vernekar, Hemantha Kumar, and K. V. Gangadharan. “Gear Fault Detection Using Vibration Analysis and Continuous Wavelet Transform.” Procedia Materials Science, Volume 5, 2014.
Pete Sopcik is the marketing manager for condition-based monitoring at Analog Devices. He is responsible for the strategy supporting the sensors, signal chains, and solutions required to enable condition monitoring in industrial applications. Prior to this role, Pete spent 11 years working in several different areas within Analog Devices, ranging from the design and development of integrated high-speed converters and sensor modules to the project management of system level solutions, including MEMS-based inertial measurement units. He has a B.S.E.E. from the University of Florida and an M.B.A. from Wake Forest University.
Dara O’Sullivan is a system applications manager with the connected motion and robotics team within the automation and energy business unit at Analog Devices. His area of expertise is power conversion, control, and monitoring in industrial motion control applications. He received his B.E.M. Eng.Sc., and Ph.D. degrees from University College Cork, Ireland, and has worked in industrial and renewable energy applications in a range of research, consultancy, and industry positions since 2001.