Uncovering Real-Time Bugs with Specialized RTOS Tools - Part 3
May 27, 2019
Blog

Fortunately, there are specialized tools designed specifically for debugging RTOS-based systems, yet these are often unknown to developers.
Deadlocks:
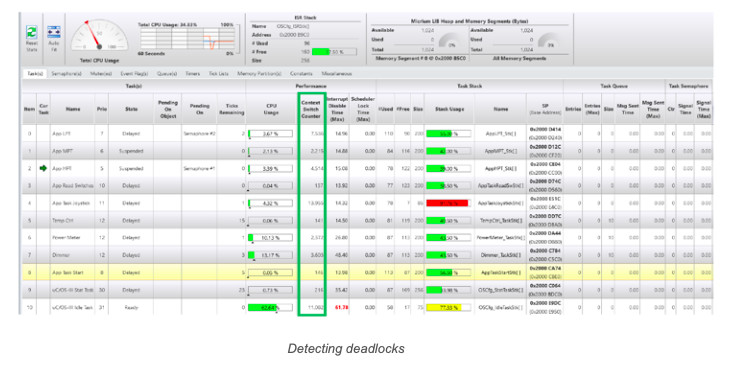
A deadlock (a.k.a. deadly embrace) is a situation in which (at least) two tasks are each unknowingly waiting for a resource that the other holds. The deadlock may not happen immediately since a lot depends on when both tasks need each other’s resource. As shown below, μC/Probe’s kernel awareness screen has a column that shows how often each task executed (i.e., how often the task was switched in by the RTOS). You can detect a deadlock by monitoring this column and notice if any of the tasks you are expecting to run are in fact running. In other words, if the counting stops (μC/Probe updates these counters while the CPU is running) then it’s possible you detected a deadlock. For this to be the case, however, you will also notice that the counting stopped for at least two tasks. You might not need to use a tool like μC/Probe to detect deadlocks since, in any case, you ought to notice the lockup behavior of those tasks in your application. However, the tool makes it more obvious.
You can avoid deadlocks by:
- Always acquiring all required resources and always acquiring them in the same order and releasing them in the reverse order.
- Using timeouts on RTOS API calls to avoid waiting forever for the resource to be available. Make sure you examine the return error code from the RTOS API to ensure that your request to the desired resource was indeed successful.
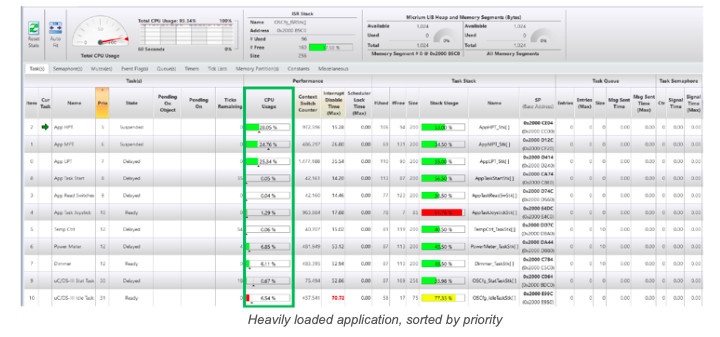
Starvation:
Starvation occurs when high-priority tasks consume all the CPU’s bandwidth leaving little or no CPU time for lower priority tasks. Effects of starvation are characterized by a degradation in responsiveness and product features, such as the display of your embedded target updating slowly, loss of packets in communications stacks, sluggish operator interface, etc. There is little you can do to fix these issues other than to:
- Optimize the code that consumes most of the CPU’s bandwidth.
- Increase the CPU’s clock speed. This is seldom an option because of other system considerations.
- Select another CPU. This is also rarely an option, especially late in the development cycle.

Monitoring Task and ISR Execution Times
It is often useful to know the execution time of tasks and ISRs to help with RTOS-based system analysis, such as Rate Monotonic Analysis (RMA). Specifically, with this information, you can determine whether all time-critical tasks can meet their deadlines as well as help you assign priorities for tasks. Unfortunately, this information is only truly accurate and available after a system has been designed and run. In other words, the actual execution time of code is often not accurately known until it is executed on the actual target. However, once available, task and ISR execution times are highly useful to confirm assumptions made during system design.
SystemView provides min/max execution times of both tasks and ISRs as shown in the screenshot below.
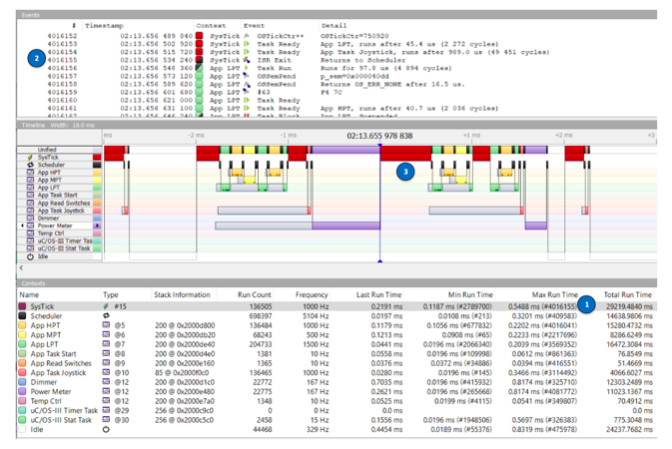
1 - The Max Run Time column in the Context pane shows the maximum execution time of all the tasks and ISRs. In the case of the SysTick (i.e. the tick ISR), the longest execution time was 0.5488 ms. We can determine when (in time) this longer execution time occurred by searching for Event #4016155. You would simply select Go to event … from the Go menu and type 4016155 followed by Enter.
2 - The Events window shows that this corresponds to the ISR exit. In fact, this makes sense as the maximum execution time of the ISR is only known when the ISR exits.
3 - Double-clicking on the line showing event #4016155 in the Events window forces the Timeline window to show that event. As can be seen, the SysTick execution is wider than other execution times.
In most cases, you don’t need to find where (in time) the maximum execution time of a task or ISR occurred, especially if you are only using that information for RMA. However, in some cases, you might need to find out why execution time took substantially longer than anticipated or expected. Unfortunately, SystemView might not be able to provide additional clues as to the reason this is happening. This is where you might want to use a code execution trace tool, such as Segger’s J-Trace and examine the code executed by the ISR prior to event #4016155.
Measuring Execution Time of User Code
There are many ways to measure code execution time. One way is to use a trace-capable debug probe. You simply run the code, look at the trace, compute the delta time (typically manually) and convert CPU cycles to microseconds. Unfortunately, the trace gives you one instance of execution, and you might have to look further down the trace capture to find the worst-case execution time. This can be a tedious process. Another way is to instrument your code and take snapshots of an available free-running counter at different places in your code and calculate the difference between snapshot readings. This was actually described in a paper published in Embedded Computing Design [7] for Cortex-M MCUs, but the concept applies equally well for other targets. The paper provides APIs to measure elapsed times. You simply wrap the code to measure as follows:
elapsed_time_start(n);
// Code to measure
elapsed_time_stop(n);
Where “n” specifies one of “n” bins (0 to n-1) where the minimum and maximum execution times are saved as follows:
elapsed_time_tbl[n].min
elapsed_time_tbl[n].max
In the case of the Cortex-M, the execution times are saved in CPU clock frequency units.
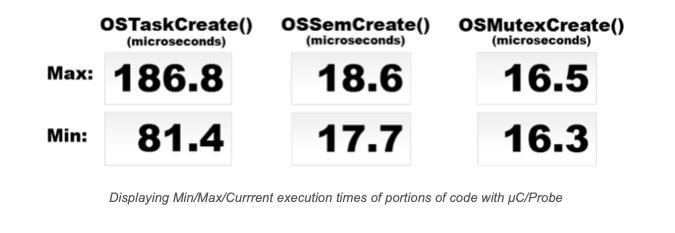
As shown below, you can use Micrium’s μC/Probe to easily display the results in microseconds. μC/Probe allow numbers to be scaled, and, in this case, the adjustment is made to account for the CPU clock frequency of the evaluation board used.
Summary
Debuggers built into IDEs are often insufficient to debug live RTOS-based systems.
Fortunately, there are specialized tools designed specifically for debugging RTOS-based systems, yet these are often unknown to developers. One of these tools is Segger’s SystemView [4], which displays ISRs and tasks on a timeline as well as gathering run-time statistics, such as minimum and maximum execution times, relationship between ISRs and tasks, CPU load and more.
Another tool that can compliment SystemView is Micrium’s μC/Probe [3], which is a general-purpose tool that allows the developer to visualize and alter the behavior of a running embedded target without interfering with the CPU. μC/Probe works equally well in bare-metal or RTOS-based applications. For RTOS-based applications, μC/Probe includes non-intrusive, live kernel awareness as well as TCP/IP stack awareness. Both types of tools (SystemView and μC/Probe) should be used early and throughout the development cycle to provide feedback about the run-time behavior of embedded targets.
References
[1] Jean Labrosse, “Detecting Stack Overflows (Part 1 and Part 2)”.
https://www.micrium.com/detecting-stack-overflows-part-1-of-2
https://www.micrium.com/detecting-stack-overflows-part-2-of-2/
[2] SEGGER, “Debug Probes,”
https://www.segger.com/jlink-debug-probes.html
[3] Micrium, “μC/Probe, Graphical Live Watch.,”
https://micrium.com/ucprobe/about/
[4] SEGGER, “SystemView for μC/OS,”
https://www.micrium.com/systemview/about/
www.segger.com/systemview.html
[5] Silicon Labs, “Simplicity Studio”
http://www.silabs.com/products/mcu/Pages/simplicity-studio.aspx
[6] Percepio, “Tracealyzer”
[7] Jean Labrosse, “Measuring code execution time on ARM Cortex-M MCUs”
http://www.embedded-computing.com/hardware/measuring-code-execution-time-on-arm-cortexm-mcus
This blog is part 3 in a three-part series, to read part 1 click here, to read part 2, click here.