Cloud orchestration and real-time analytics to avoid downtime
March 01, 2014

In this article, GigaSpaces will describe how to build a system using a Complex Event Processing (CEP) engine for collecting sensor information and an...
According to the AppsDynamics blog “How much does downtime cost,” network downtime expenses increased by an average of 65 percent from 2010-2012 despite a decreasing number of downtime hours per organization over the same period (Figure 1) [1]. One possible explanation for this trend is that larger portions of business are being done online, making the overall impact of downtime bigger on an organization’s bottom line.
|
|

With the move to cloud and Software-as-a-Service-based (SaaS-based) delivery models where both customer-facing applications and entire IT infrastructures are exposed to online service, the impact of downtime could easily shut down an entire organization. IT departments are facing huge pressure from the enterprise to become more agile, and one of the simplest paths to agility is moving to a cloud-based environment. The problem this presents, however, is that moving to a more dynamic cloud environment brings with it an increased risk of failure. Most existing IT management systems were built for static environments, and at most provide alert monitoring that requires human intervention to fix problems. This type of system has become impractical, as the amount of data and number of events that systems generate has grown to the point that most human operators are not able to keep pace; the result is increased human error.
A recent Gartner study projected that through 2015, “80 percent of outages impacting mission-critical services will be caused by people and process issues, and more than 50 percent of those outages will be caused by change, configuration, release integration, and handoff issues[2].” So what can be done? The solution is to move from static monitoring to a completely reactive system that can identify and fix issues as they happen – without human intervention.
The solution
Figuring out a solution isn’t difficult. If 80 percent of downtime is a result of human error during deployment and recovery processes, then the solution would be to remove those errors through automation. Being that IT processes can be fairly complex and are not automated easily, Figure 2 outlines a sample of IT processes that involve manual intervention. For example, these could include taking newly developed software packages to production, the installation of monitoring for new features or applications, performance tuning, and troubleshooting to name just a few.
|
|

Automating application deployment and management
Automating application deployment and corresponding practices is done by replacing manual procedures with software-driven processes. Cloud-based infrastructures are a major enabler of these techniques, as they provide a means for controlling entire data centers with software rather than human operators. Figure 3 illustrates the main components for automating an end-to-end application deployment, including:
|
|

- Cloud infrastructure – Provides software-driven access to all IT resources through an Application Programming Interface (API).
- Intelligent orchestration – The software equivalent of a human operator.
- Historical data – Stores previous states and events, which are used to determine whether an application is behaving as expected and adjust system thresholds according to actual activities. Historical data is also used as a source for root cause analysis in the event of failure.
- Real-time analytics – Updates monitoring counters, including complex compound CPU latency metrics, and also triggers alerts when an event breaches a certain threshold.
At the heart of this architecture is orchestration. The orchestrator creates a definition for a given application that is run through a software-readable instruction set to map out an application blueprint. The orchestrator is also responsible for ensuring that the application meets Service-Level Agreements (SLAs), which is probably its most challenging function as this requires some degree of Artificial Intelligence (AI).
To achieve the necessary AI, a feedback loop must be established that is both capable of identifying if an application is behaving as expected and taking corrective action if it is not. The feedback loop starts by collecting real-time feeds from an application before processing them in real time to detect failure or capacity issues. Quite often, however, determining whether a given alert is real or a false alarm involves correlation with historical data. For example, high CPU utilization isn’t always an indication of an issue if increased loads are expected; at the same time, low CPU usage can indicate a lack of traffic that isn’t necessarily an indication of application stability. Analysis from real-time and batch reporting closes the loop by reporting current and historical data back to the orchestrator, which in turn can take corrective action. This loop also helps to adjust the application behavior threshold in real-time so that false alarms can be minimized in the future.
Automated application deployment in action
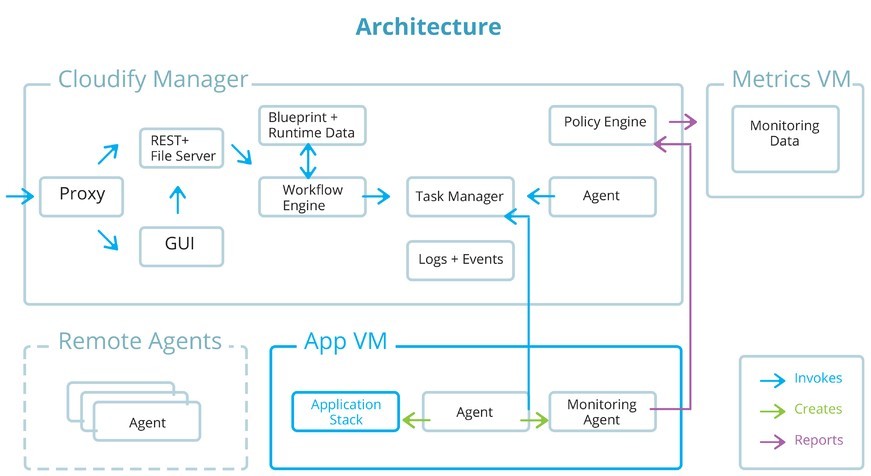
Using the Topology and Orchestration Specification for Cloud Applications (TOSCA) as a standard framework for application blue prints, GigaSpaces’ Cloudify is an orchestration engine that defines application components (nodes), their dependencies, as well as their metrics and associated policies (how to install the components, handle failure, or scale events, for instance) to configure the foundational network for process automation. Once application definitions are run and the TOSCA blue print is loaded, the Cloudify orchestration engine executes the blue print to spawn the necessary Virtual Machines (VMs) and corresponding network resources (such as storage). The orchestrator then installs the application’s various components, organizing them according to their place in the dependency chain. Finally, application monitoring is integrated as a plug in, and each component sends metrics back to the orchestrator through a monitoring agent.
Afterward, a policy engine uses complex event servicing to determine if the application meets its SLAs, and will trigger an action in the case of a breach that could include spawning new VMs or redistributing the system load. Figure 4 illustrates multi-tiered application deployment in a TOSCA-based model.
|
|
Cloud-based automation – in real time
As day-to-day operations in the enterprise are continually absorbed by the network infrastructure, conventional IT processes will not be equipped to facilitate massive upticks in events and data. Moreover, adding a human element to process management could, for the first time, introduce setbacks rather than benefits in the evolving IT environment. In situations where uptime is mission-critical, cloud-based automation enables an efficient means of mitigating downtime while freeing IT managers until they are needed the most.
GigaSpaces
References:
1. Mappic, Sandy. “How much does downtime cost?” http://www.appdynamics.com/blog/2013/09/04/how-much-does-downtime-cost/
2. “Downtime, Outages and Failures - Understanding Their True Costs.” http://www.evolven.com/blog/downtime-outages-and-failures-understanding-their-true-costs.html
3. OASIS Topology and Orchestration Specification for Cloud Applications (TOSCA) TC. https://www.oasis-open.org/committees/tc_home.php?wg_abbrev=tosca